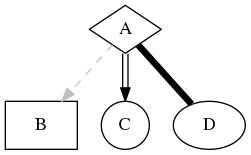
This example uses a edge's attribute style to draw a dotted edge.
digraph D {

  A [shape=diamond]
  B [shape=box]
  C [shape=circle]

  A -> B [style=dashed, color=grey]
  A -> C [color="black:invis:black"]
  A -> D [penwidth=5, arrowhead=none]

}
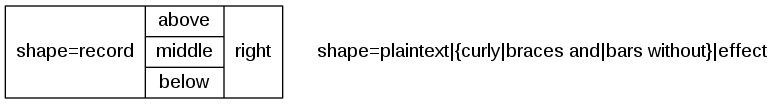
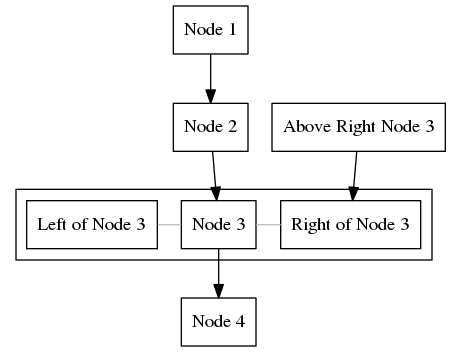
Normally, a dependency (an edge) is declared with an arrow: Node1 -> Node2. Multiple nodes can be listed in curly braces, thus declaring multiple edges in one go.
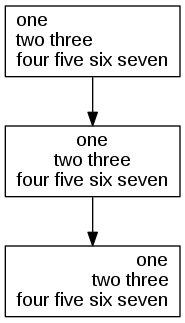
\l makes the preceding (!) text left aligned, \n makes it centered and \r makes it right aligned.
digraph L {

  node [shape=record fontname=Arial];

  a  [label="one\ltwo three\lfour five six seven\l"]
  b  [label="one\ntwo three\nfour five six seven"]
  c  [label="one\rtwo three\rfour five six seven\r"]

  a -> b -> c

}
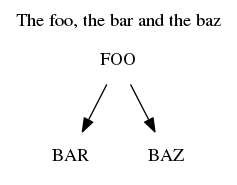
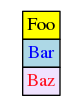
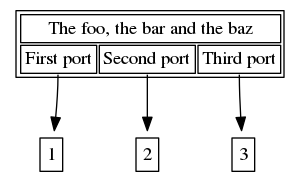
digraph D {

  label = "The foo, the bar and the baz";
  labelloc = "t"; // place the label at the top (b seems to be default)

  node [shape=plaintext]

  FOO -> {BAR, BAZ};


}
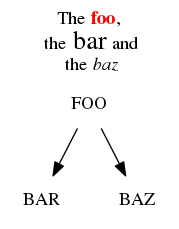
If the text of label is enclosed in <…> rather than in "…", the text is treated as HTML and rendered as HTML like label.
digraph D {

  label = <The <font color='red'><b>foo</b></font>,<br/> the <font point-size='20'>bar</font> and<br/> the <i>baz</i>>;
  labelloc = "t"; // place the label at the top (b seems to be default)

  node [shape=plaintext]

  FOO -> {BAR, BAZ};

}
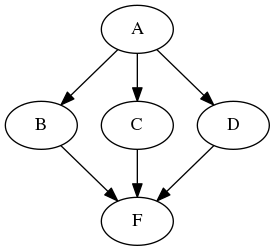
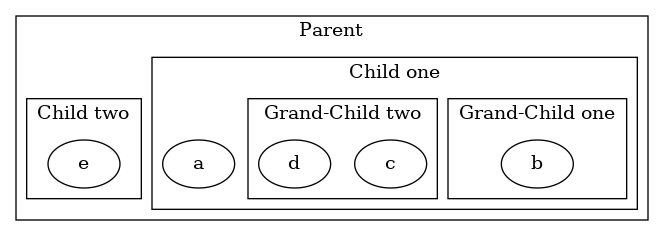
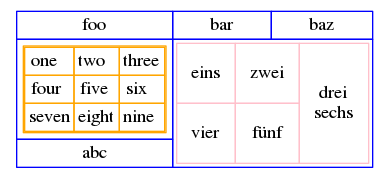
{ rank=same node_1 node_2 … } specifies that the specified nodes have the same rank, that is, that their distance from the top or left border is equal.
digraph R {

  node [shape=record];

  { rank=same rA sA tA }
  { rank=same uB vB wB }


   rA -> sA;
   sA -> vB;
   t  -> rA;
   uB -> vB;
   wB -> u;
   wB -> tA;

}
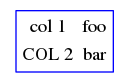
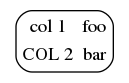
HTML tables are produced if the value of the label attribute is enclosed in <…> rather than "…":
digraph H {

  aHtmlTable [
   shape=plaintext
   color=blue      // The color of the border of the table
   label=<

     <table border='1' cellborder='0'>
       <tr><td>col 1</td><td>foo</td></tr>
       <tr><td>COL 2</td><td>bar</td></tr>
     </table>

  >];

}