Search notes:

R function: colorRampPalette

colorRampPalette returns a function. The function can then be called with a positive integer argument n and the function will return a palette with n entries.
paletteFunc <- colorRampPalette(…); # Create function
palette     <- paletteFunc(8);      # invoke function to create a palette with eight entries.

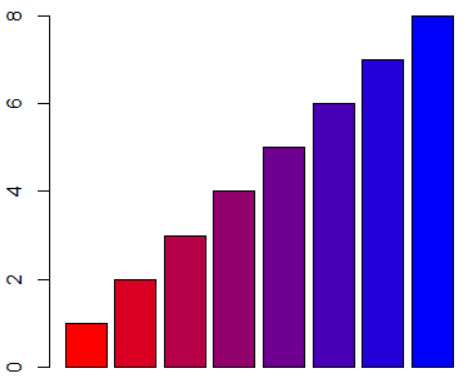
Create a palette from red to blue

The following example creates a palette from red to blue with 8 entries and uses barplot to display these:
paletteFunc <- colorRampPalette(c('red', 'blue'));
palette     <- paletteFunc(8);

barplot(1:8, col=palette);
Github repository about-r, path: /functions/colorRampPalette/red-to-blue.R

TODO

crp <- colorRampPalette(c('red', 'blue', 'yellow'))

typeof(crp)
# [1] "closure"

pal <- crp(20)
typeof(pal)
# [1] "character"

length(pal)
# [1] 20

pal
#  [1] "#FF0000" "#E4001A" "#C90035" "#AE0050" "#93006B" "#780086" "#5D00A1"
#  [8] "#4300BB" "#2800D6" "#0D00F1" "#0D0DF1" "#2828D6" "#4343BB" "#5D5DA1"
# [15] "#787886" "#93936B" "#AEAE50" "#C9C935" "#E4E41A" "#FFFF00"
Github repository about-r, path: /functions/colorRampPalette.R

See also

The RColorBrewer package.
R functions for colors
Using colorRampPalette to color the highs and lows in a surface graphic that was created with persp.
R functions for colors

Index