Show all palettes
library(RColorBrewer)
display.brewer.all()
Github repository about-r, path: /packages/RColorBrewer/display.brewer.all.R
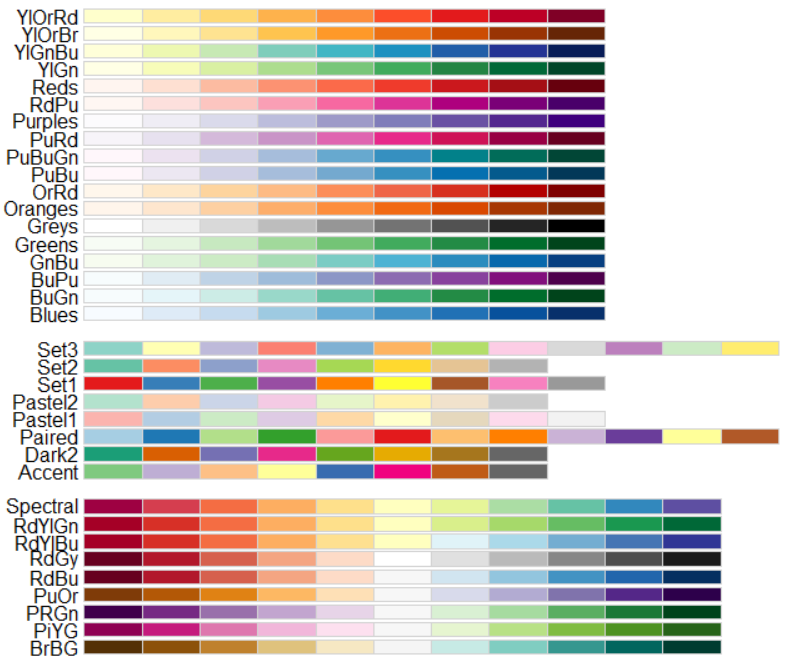
RColorBrewer can be used to create colorful graphs with pre-made palettes that consist of 8 to 12 colors. In order to create more colors in a palette, colorRampPalette can be used. library(RColorBrewer) display.brewer.all()
library(RColorBrewer)
library(raster)

palette = brewer.pal(11,'RdYlBu');

grid <- raster(ncols=11, nrows = 1, xmn=1, xmx=11, ymn=1,ymx=2);

values(grid) <- 1:11

par(mar=rep(0.5, 4))
plot(grid, col=palette, legend=FALSE, axes = 0, box=FALSE)

palette_explorer in the package tmaptools is an interactive application (package shiny) that allows to explore Color Brewer and viridis palettes.