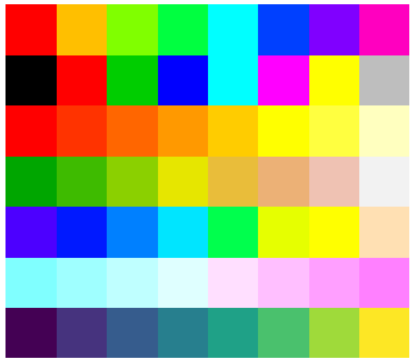
Some palletes
The following example shows some palettes drawn with
raster: library(RColorBrewer)
library(viridis)
library(raster)
nofColors <- 8;
palettes <- c(
rainbow (nofColors),
palette ( ), # palette has 8 colors
heat.colors (nofColors),
terrain.colors(nofColors),
topo.colors (nofColors),
cm.colors (nofColors),
viridis (nofColors)
);
nofPalettes <- length(palettes) / nofColors;
grid <- raster(
ncols = nofColors,
nrows = nofPalettes,
xmn = 0,
xmx = nofColors,
ymn = 0,
ymx = nofPalettes
);
values(grid) <- 1:(nofPalettes * nofColors)
par(mar=rep(0.5, 4))
plot(grid,
col = palettes,
legend = FALSE,
axes = 0,
box = FALSE
);
Github repository about-r, path: /graphics/coloring/palettes/some.R