Search notes:
R function: barplot
Visualize the values of a vector
In its simplest form,
barplot can be used to visualize the values in a
vector.
vec <- c(2, 1, 2, 4, 4, 1, 2, 2, 1, 3, 4, 2);

barplot(vec);
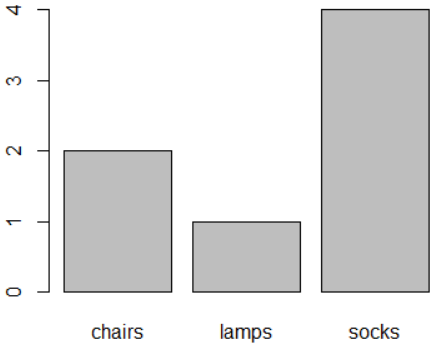
Counting occurrences of elements
The elements in a vector can be counted with
table and the bar-plotted which reveals how often a specific element (string) occurs in the vector:
things <- c(
    'socks' ,
    'chairs',
    'socks' ,
    'lamps' ,
    'chairs',
    'socks' ,
    'socks'
);

countOfThings <- table(things);

print(countOfThings);
#
# things
# chairs  lamps  socks
#      2      1      4

barplot(countOfThings);
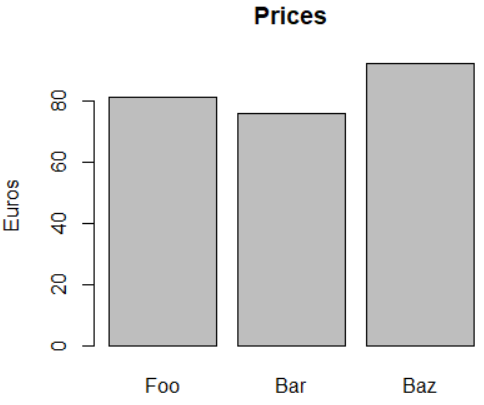
Naming (labeling) bars
With
names, the elements in a vector can be given a name which will then be displayed below the bars in the plot:
      prices  <- c(  81 ,   76 ,   92 );
names(prices) <- c('Foo', 'Bar', 'Baz');

barplot(prices, main='Prices', ylab='Euros');
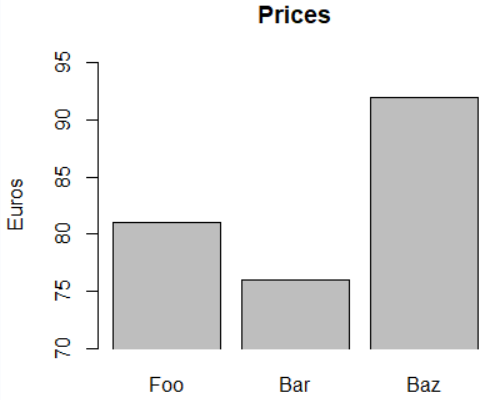
Limitting the y range
      prices  <- c(  81 ,   76 ,   92 );
names(prices) <- c('Foo', 'Bar', 'Baz');

barplot(prices, main='Prices', ylab='Euros', ylim=c(70, 95), xpd=FALSE) # xpd: Should bars be allowed to go outside region?
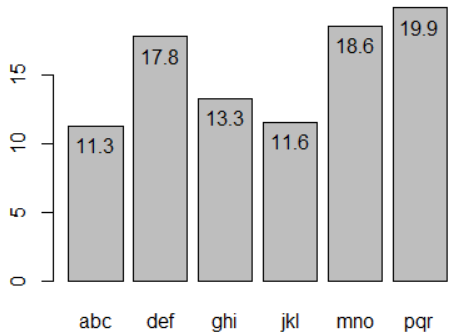
Adding the values of the bars to plot
set.seed(28)
values = round(rnorm(6, 18, 3.5), 1);
names(values) <- c('abc', 'def', 'ghi', 'jkl', 'mno', 'pqr');

y_coords = barplot(values)

text(y_coords, values, labels=values, pos=1)
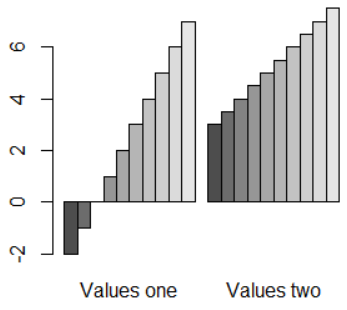
Displaying multiple barplots besides each other
val_1 <-  (1:10) - 3
val_2 <- ((1:10) + 5) / 2

barplot (
  cbind(val_1, val_2),
  beside =  TRUE,
  names  = c('Values one', 'Values two')
);