Natural logarithm
log(eⁿ ) =  n
log(e⁰ ) =  0 = log(1)
log(e¹ ) =  1 = log(e)
log(e² ) =  2
log(e⁻¹) = -1 = log(1/e)
log(x * y) = log(x) + log(y)
import numpy as np
import matplotlib.pyplot as plt

x = np.linspace(0.01, np.e**2 + 0.1, 100)
y = np.log(x)

plt.plot(x, y, label='log(x)')

def mark_coord(x, label, offset):
    y = np.log(x)
    plt.scatter(x, y, color='red')
    plt.annotate(label, (x, y), textcoords="offset points", xytext=offset   , ha='center', fontsize=8, color='red')


mark_coord(  1/np.e  , 'log(1/e)', ( 22, -7))
mark_coord(  1       , 'log(1)'  , ( 14,-10))
mark_coord(  np.e    , 'log(e)'  , (-10,  6))
mark_coord(  np.e**2 , 'log(e^2)', (-10,-11))

plt.xlabel('x')
plt.ylabel('log(x)')
plt.title('Natuaral logarithm')

plt.grid()
plt.savefig('img/natural-logarithm.png')
Logistic function
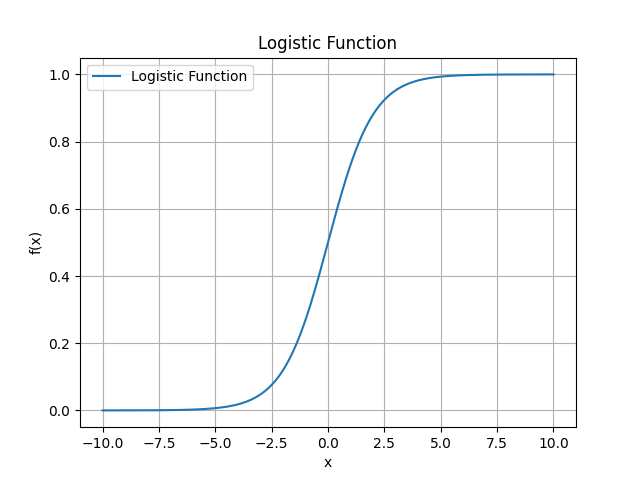
The logistic function is a
sigmoid function and thus
- produces a value between 0 and 1
- is defined for all real input values
- has a non-negative derivatative at each point
- exactly one inflection point (which IMHO makes the derivative bell shaped?)
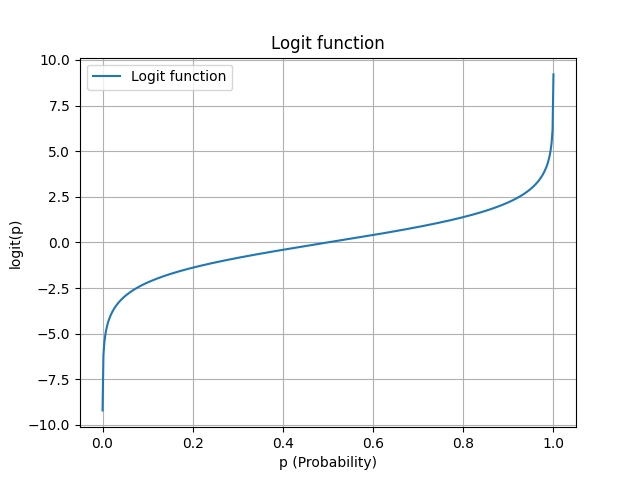
The inverse of the logistic function is the logit function.
The following plot draws the
standard logistic function:

It was created with
import numpy as np
import matplotlib.pyplot as plt

def standard_logistic(x):
    return 1 / (1 + np.exp(-x))

x_values = np.linspace(-10, 10, 400)

y_values = standard_logistic(x_values)

plt.plot(x_values, y_values, label='Logistic Function')
plt.xlabel('x')
plt.ylabel('f(x)')

plt.title("Logistic Function")

plt.grid()
plt.legend()

# plt.show()
plt.savefig('img/standard-logistic-function.png')
TODO
Sigmoid functions are commonly used as activation funcions in neural networks.
Logit function
import numpy as np
import matplotlib.pyplot as plt

def logit(p):
    return np.log(p / (1 - p))

p_values = np.linspace(0.0001, 0.9999, 500)

y_values = logit(p_values)

plt.plot(p_values, y_values, label='Logit function')
plt.xlabel('p (Probability)')
plt.ylabel('logit(p)')

plt.title('Logit function')

plt.grid()
plt.legend()

# plt.show()
plt.savefig('img/logit.png')
softmax
softmax takes k numbers and produces k numbers each of which is between 0 and 1 and whose sum is equal to 1.
The softmax function is often applied as final function to a neural network.
The following Python script computes the softmax of the values stored in z:
import math

z = [ 0.8, -0.2, 2.1, 1.3, -0.8]

# temporary values:
t = [ math.e ** z_ for z_ in z ]

σ = [ t_ / sum(t) for t_ in t ]

for i , σ_i in enumerate(σ):
    print(f'σ_{i} = {σ_i:04.3f}')

print(f'Sum(σ) = {sum(σ):04.3f}')
When executed, the script prints:
σ_0 = 0.145
σ_1 = 0.053
σ_2 = 0.533
σ_3 = 0.239
σ_4 = 0.029
Sum(σ) = 1.000


