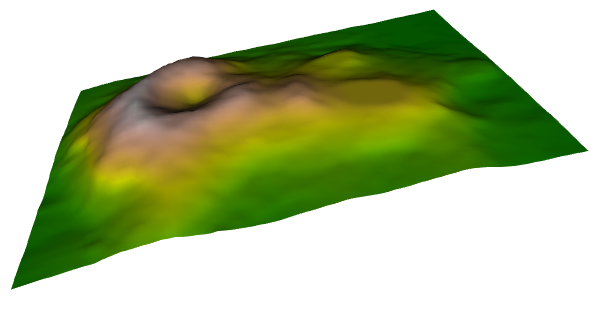
Plotting the volcano with rgl
The data of the volcano might be plotted with the
rgl package.
2019-08-28: When I initially wrote the script, I used
rgl.open(), rgl.bg(), rgl.surface() and rgl.bringtotop(). At that time, I didn't know that these are low level functions and should not be used, if possible. I now replaced them with the open3d() and surface3d() which produce the same result (yet I had to change the values in the matrix in the call of view3d).
The
rgl.… functions are commented, for remembering purposes. library(rgl)
#
# volcano is a matrix that stores z values. Make this
# fact more explicit:
#
z <- volcano
#
# Two vectors that contain the «meters» from the zero point.
# A cell in the grid is 10x10 meters, so we need to multiply
# the vectors by 10:
#
x <- 10 * (1:nrow(z)) # Should that not be ncol?
y <- 10 * (1:ncol(z)) # Should that not be nrow?
z_min = min(z)
z_diff = max(z) - z_min + 1
height_to_color <- terrain.colors(z_diff)
colors <- height_to_color[ z - z_min + 1 ];
open3d() # rgl.open()
# rgl.bg(color='white');
par3d(windowRect=c(34, 57, 727, 707))
surface3d(x, y, z, color=colors); # rgl.surface
view3d(
userMatrix = matrix(
c(
0.972062767 , -0.1212740 , -0.2009648 , 0 ,
0.234625295 , 0.4775052 , 0.8467230 , 0 ,
-0.006723508 , -0.8702192 , 0.4926187 , 0 ,
0.000000000 , 0.0000000 , 0.0000000 , 1
),
nrow = 4,
byrow = TRUE
)
)
# rgl.bringtotop()
Github repository about-r, path: /packages/datasets/volcano/rgl.R