Simple example
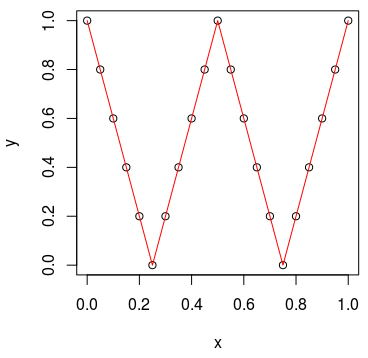
In the following example, the vector is
x and the function is func. lapply thus creates a new vector that subsequently is plotted for verification: func <- function(x) {
if (x < 0.25) {
return (1-4*x)
}
if (x < 0.50) {
return (-1 + 4*x)
}
if (x < 0.75) {
return (3 - 4*x)
}
return (-3 + 4*x)
}
x <- 0:20/20
y <- lapply(x, func)
X11()
plot(x, y)
lines(x,y, col='red')
locator(1)
Github repository about-r, path: /functions/lapply.R
