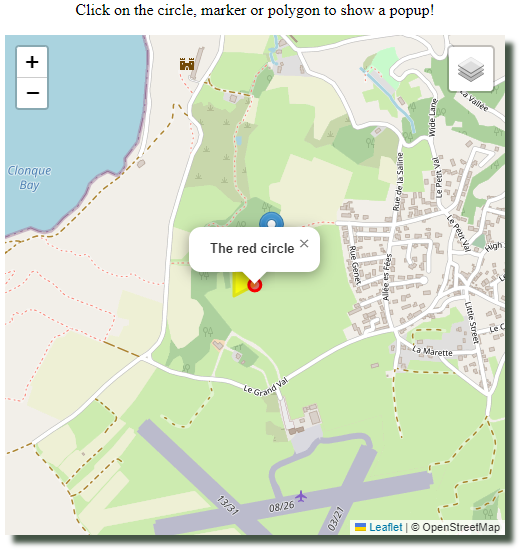
The following example tries to demonstrate how it is possible to add clickable items (a circle, a polygon and a marker) to a
Leaflet map. When the items are clicked, a text pops up:
HTML source
<!DOCTYPE html>
<html>
  <head>

    <title>Popups</title>

    <meta charset="UTF-8">
    <meta http-equiv="content-language" content="en" />

    <link rel="stylesheet" href="https://unpkg.com/leaflet@1.0.3/dist/leaflet.css" />

    <link   rel         = "stylesheet"
            href        = "https://unpkg.com/leaflet@1.9.1/dist/leaflet.css"
            integrity   = "sha256-sA+zWATbFveLLNqWO2gtiw3HL/lh1giY/Inf1BJ0z14="
            crossorigin = "" />


    <script src         = "https://unpkg.com/leaflet@1.9.1/dist/leaflet.js"
            integrity   = "sha256-NDI0K41gVbWqfkkaHj15IzU7PtMoelkzyKp8TOaFQ3s="
            crossorigin = ""></script>

    <style>
       #text{
            text-align: center
       }
       #map {
             position  : relative;
             margin    : 0 auto;
             height    : 500px;
             width     : 500px;
             box-shadow: 8px 8px 5px 0px rgba(4,25,5,0.75);
       }

     </style>


  </head>
  <body>

    <div id="text">Click on the circle, marker or polygon to show a popup!</div><p>
    <div id="map"></div>

    <script>

      var map = L.map('map', {
        center: [49.7128, -2.2165],
        zoom  :  15
      });

      L.tileLayer('https://tile.openstreetmap.org/{z}/{x}/{y}.png', {attribution: '© OpenStreetMap'}).addTo(map);

      var circle = L.circle(
         [49.7128, -2.2165],
      {  color: 'red', fillColor: '#f03', fillOpacity: 0.5, radius: 20 });

      var polygon = L.polygon([
        [49.7128, -2.2165],
        [49.7125, -2.2174],
        [49.7133, -2.2174],
        [49.7135, -2.2165] ],
      { color: '#dde21a', fillColor: 'yellow', fillOpacity: 0.9 });

      var marker = L.marker([49.7137, -2.2158]);

      marker.bindPopup ("<b>The simple marker</b>" );
      polygon.bindPopup("<b>The yellow poligon</b>");
      circle.bindPopup ("<b>The red circle</b>"    );

      var layerGrp = L.layerGroup([marker, polygon, circle]).addTo(map);
      var overlayMaps = { "Popup Elements": layerGrp };

      L.control.layers(overlayMaps).addTo(map);
    </script>

  </body>
</html>