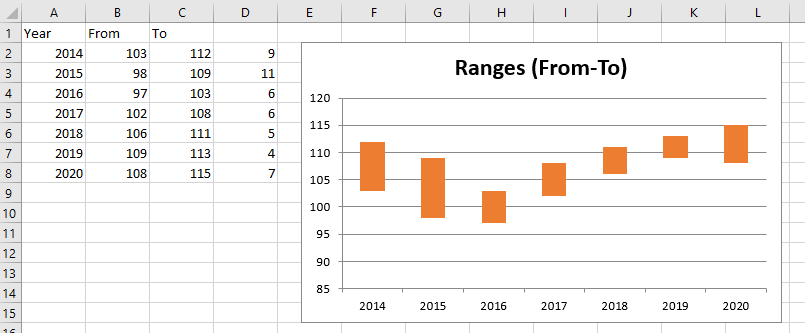
Excel VBA example: stacked column chart displaying a range
option explicit

sub main() ' {

    fillData

    dim shp as shape
    set shp =  createChart

  '
  ' Move the chart's shape:
  '
    shp.width  = 360
    shp.height = 210
    shp.top    =  15
    shp.left   = 210

end sub ' }

sub fillData() ' {

    range(cells(1,1), cells(8,3)).value       = [ { "Year", "From", "To" ; 2014 , 103,112 ; 2015 , 98,109 ; 2016 , 97,103 ; 2017 , 102,108 ; 2018 , 106,111 ; 2019 , 109,113 ; 2020 , 108,115 } ]
    range(cells(2,4), cells(8,4)).formulaR1C1 = "= RC[-1] - RC[-2]"

end sub ' }

function createChart() as shape ' {

'  dim shp as shape
   set createChart = activeSheet.shapes.addChart(xlChartType := xlColumnStacked)

   dim cht as chart
   set cht =  createChart.chart

   dim serInvisble as series
   dim serVisible  as series

   with cht.seriesCollection ' {
      '
      ' Delete potential series collection so that we
      ' can start with a new set of series.
      '
        while .count > 0 ' {
              .item(1).delete
        wend ' }

      '
      ' We need two series, an invisible one and
      ' a visible one:
      '
        set serInvisble = .newSeries
        set serVisible  = .newSeries

    end with ' }

  '
  ' The xValues range determines the categories of the
  ' series. They're shown below the column:
  '
    serInvisble.xValues = range(cells(2,1), cells(8,1))

  '
  ' The invisible and the visible series' data:
  '
    serInvisble.values  = range(cells(2,2), cells(8,2))
    servisible.values   = range(cells(2,4), cells(8,4))

  '
  ' Set lower part of column to invisible:
  '
    serInvisble.format.fill.visible = msoFalse

  '
  ' Delete the legends as they're of no use
  ' for this kind of chart, imho.
  '
    cht.legend.legendEntries(1).delete
    cht.legend.legendEntries(1).delete

  '
  ' I don't really understand why the call of chartWizard is necessary, but without it,
  ' all charts but the first are not drawn.
  '
    cht.chartWizard

  '
  ' Add the title for the chart
  '
    cht.setElement(msoElementChartTitleAboveChart)
    cht.chartTitle.text = "Ranges (From-To)"

end function ' }